Problem
Indeed’s Career Services team had created several standalone pages for difference services ranging from resume review and writing to interview and career counseling.
Research showed that the pages didn’t communicate the service’s values to customers, and the information on them was hard to parse.
The navigation was also unintuitive and users did not understand that Indeed offered a suite of career services options.
Process
I conducted competitive research and designed information architecture for a hub and spoke approach to the page with a home page and product pages. After user-testing these prototypes, I iterated on the design and then created reproducable models governing the architecture for existing and future product pages.
Role
I led information architecture design and UI content design for the project, and collaborated with UX design and UX research during for high-fidelity designs and prototype testing.
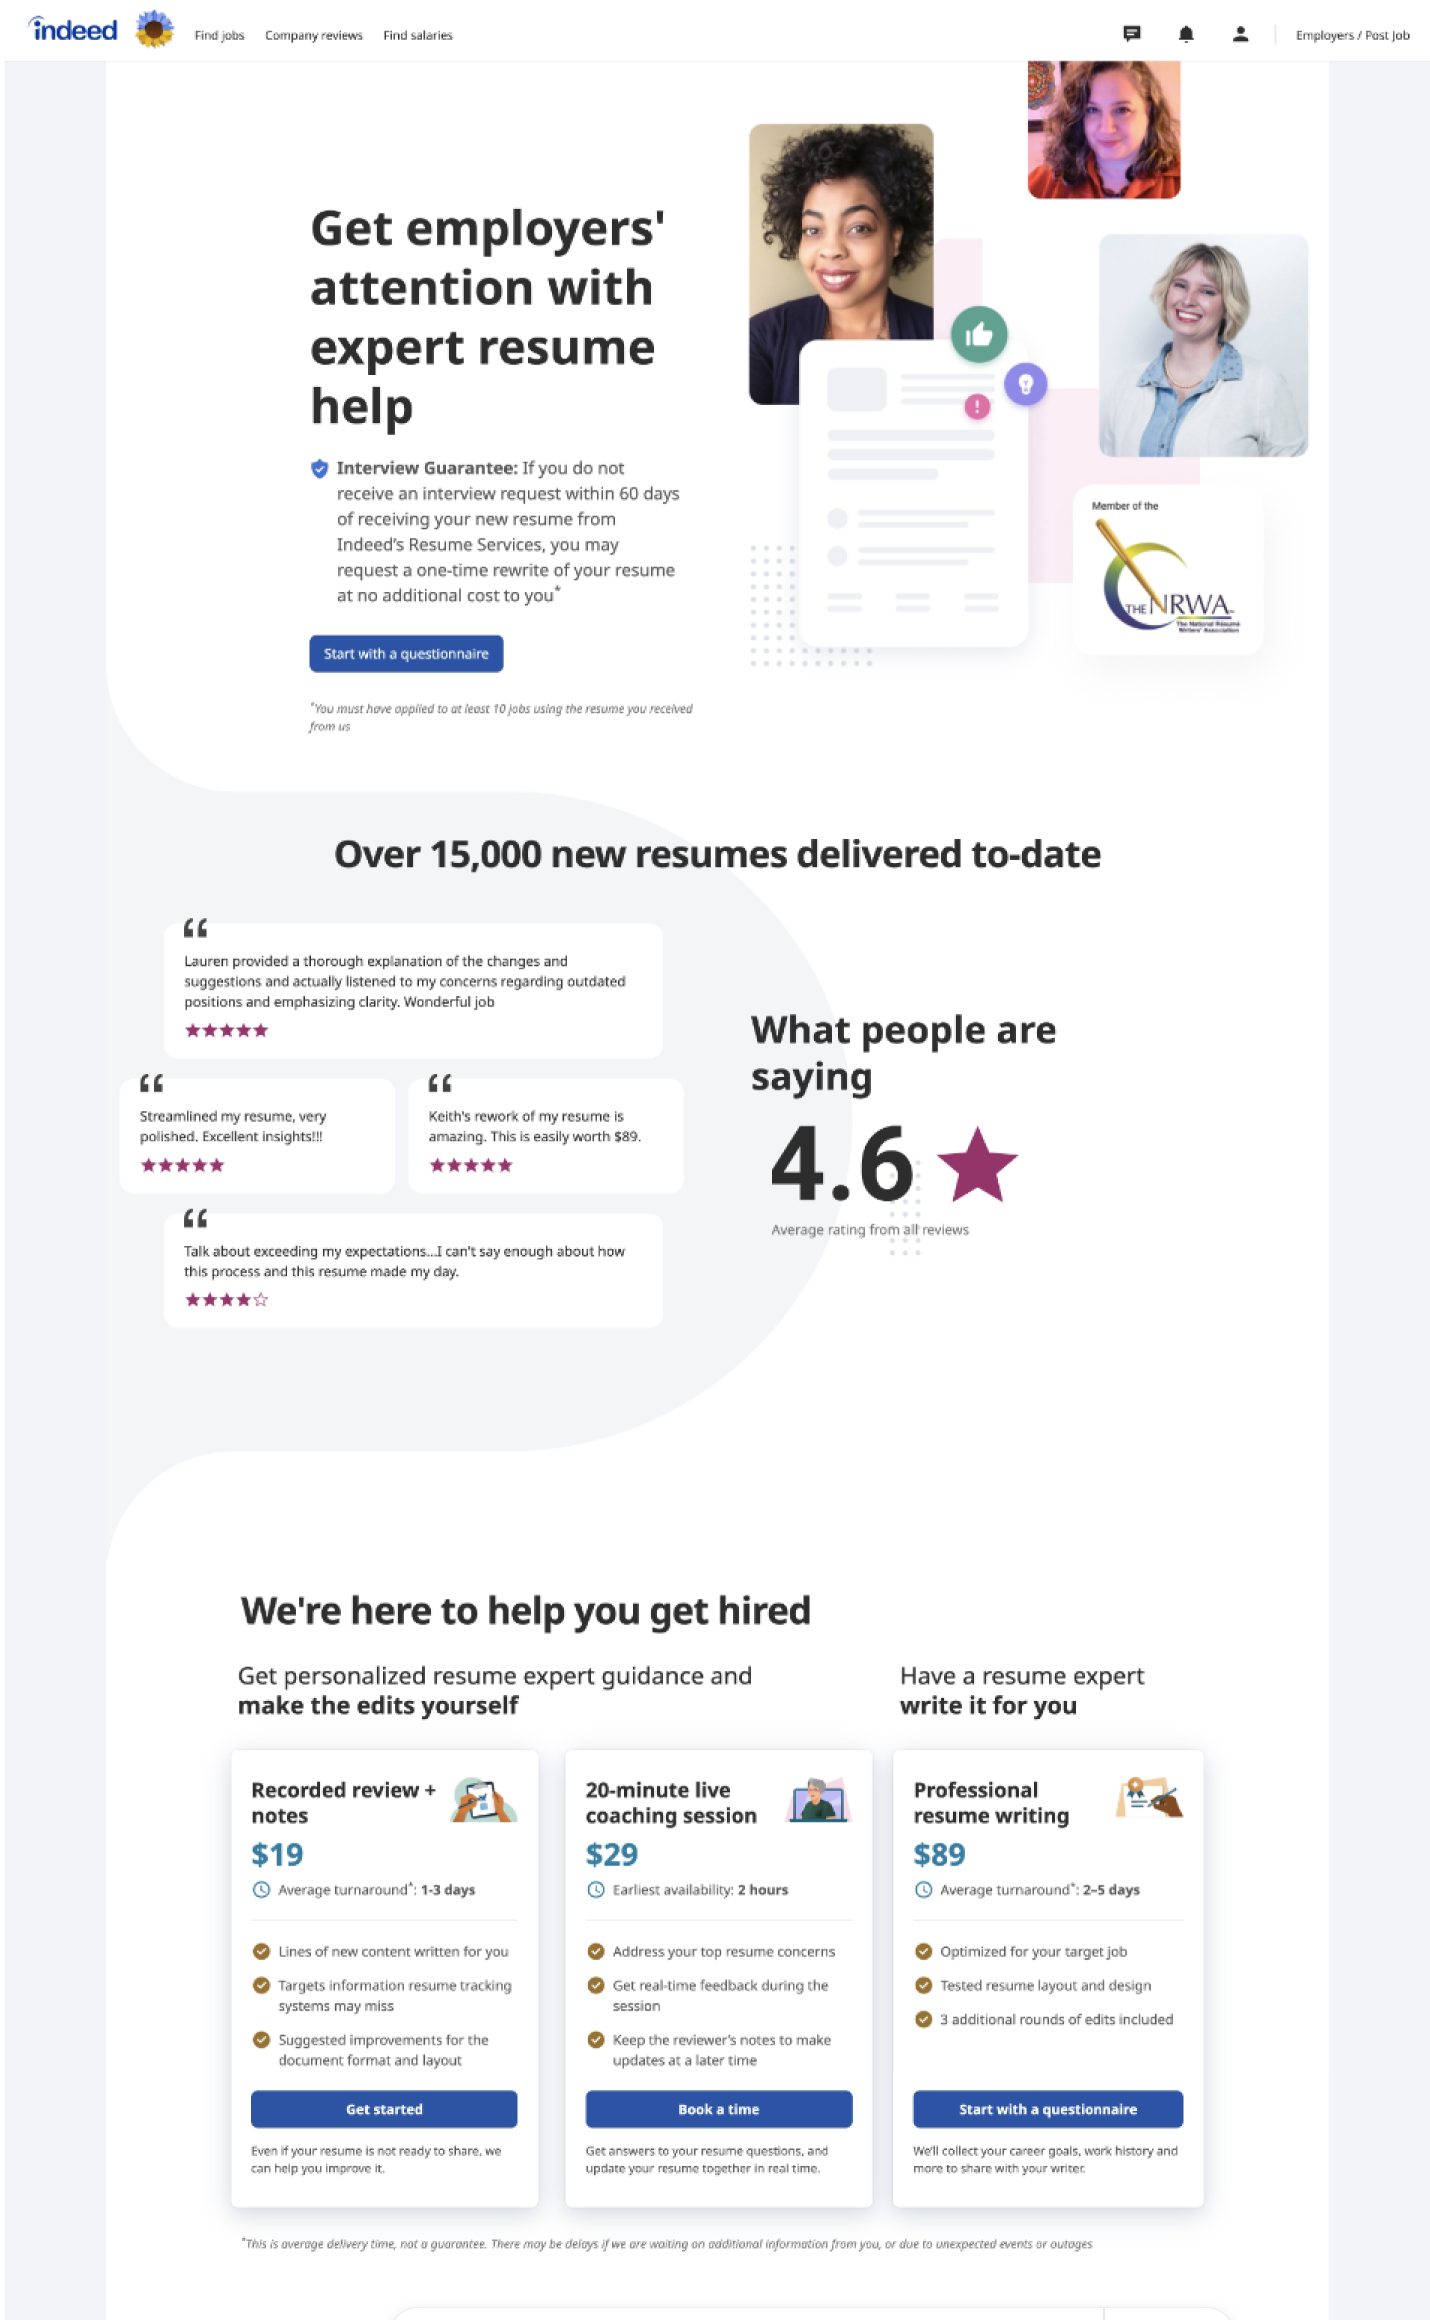
Existing design
The existing design was cluttered, and research showed users were unable to determine the service’s value.
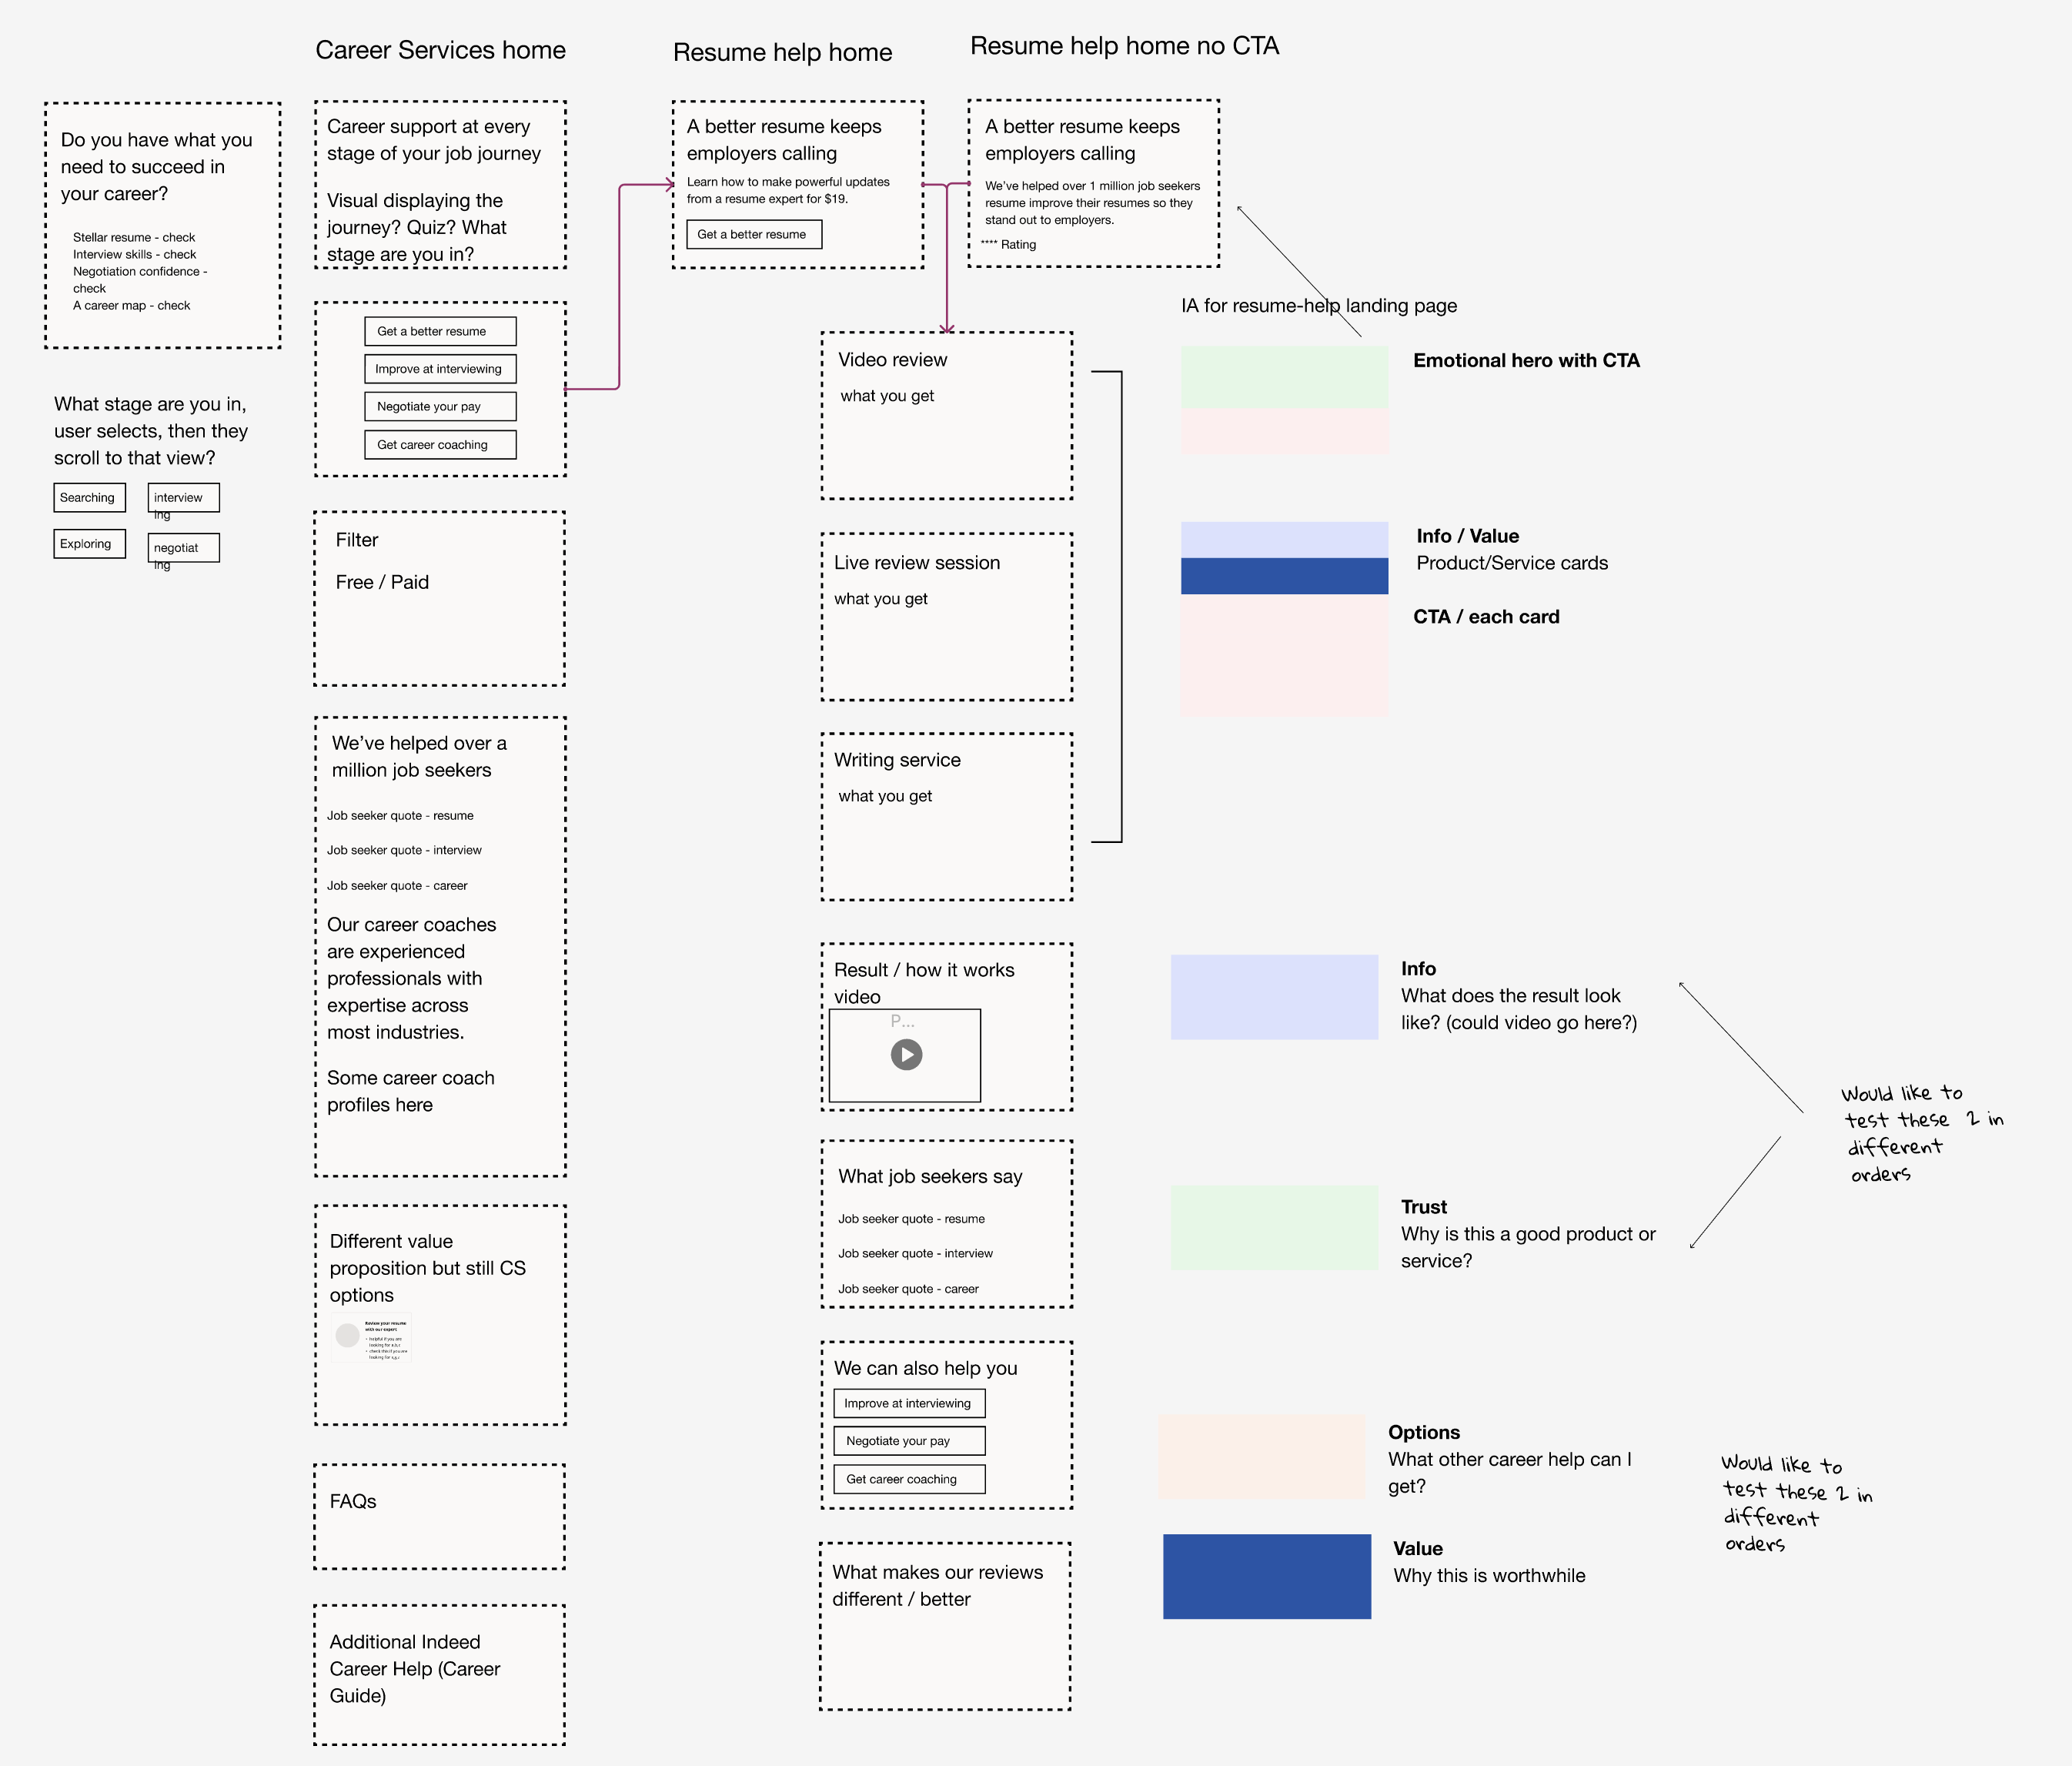
Discovery
I drafted some diagrams and early information architecture proposals for a hub-and-spoke design. I then worked with our designer and UX researcher to test these.
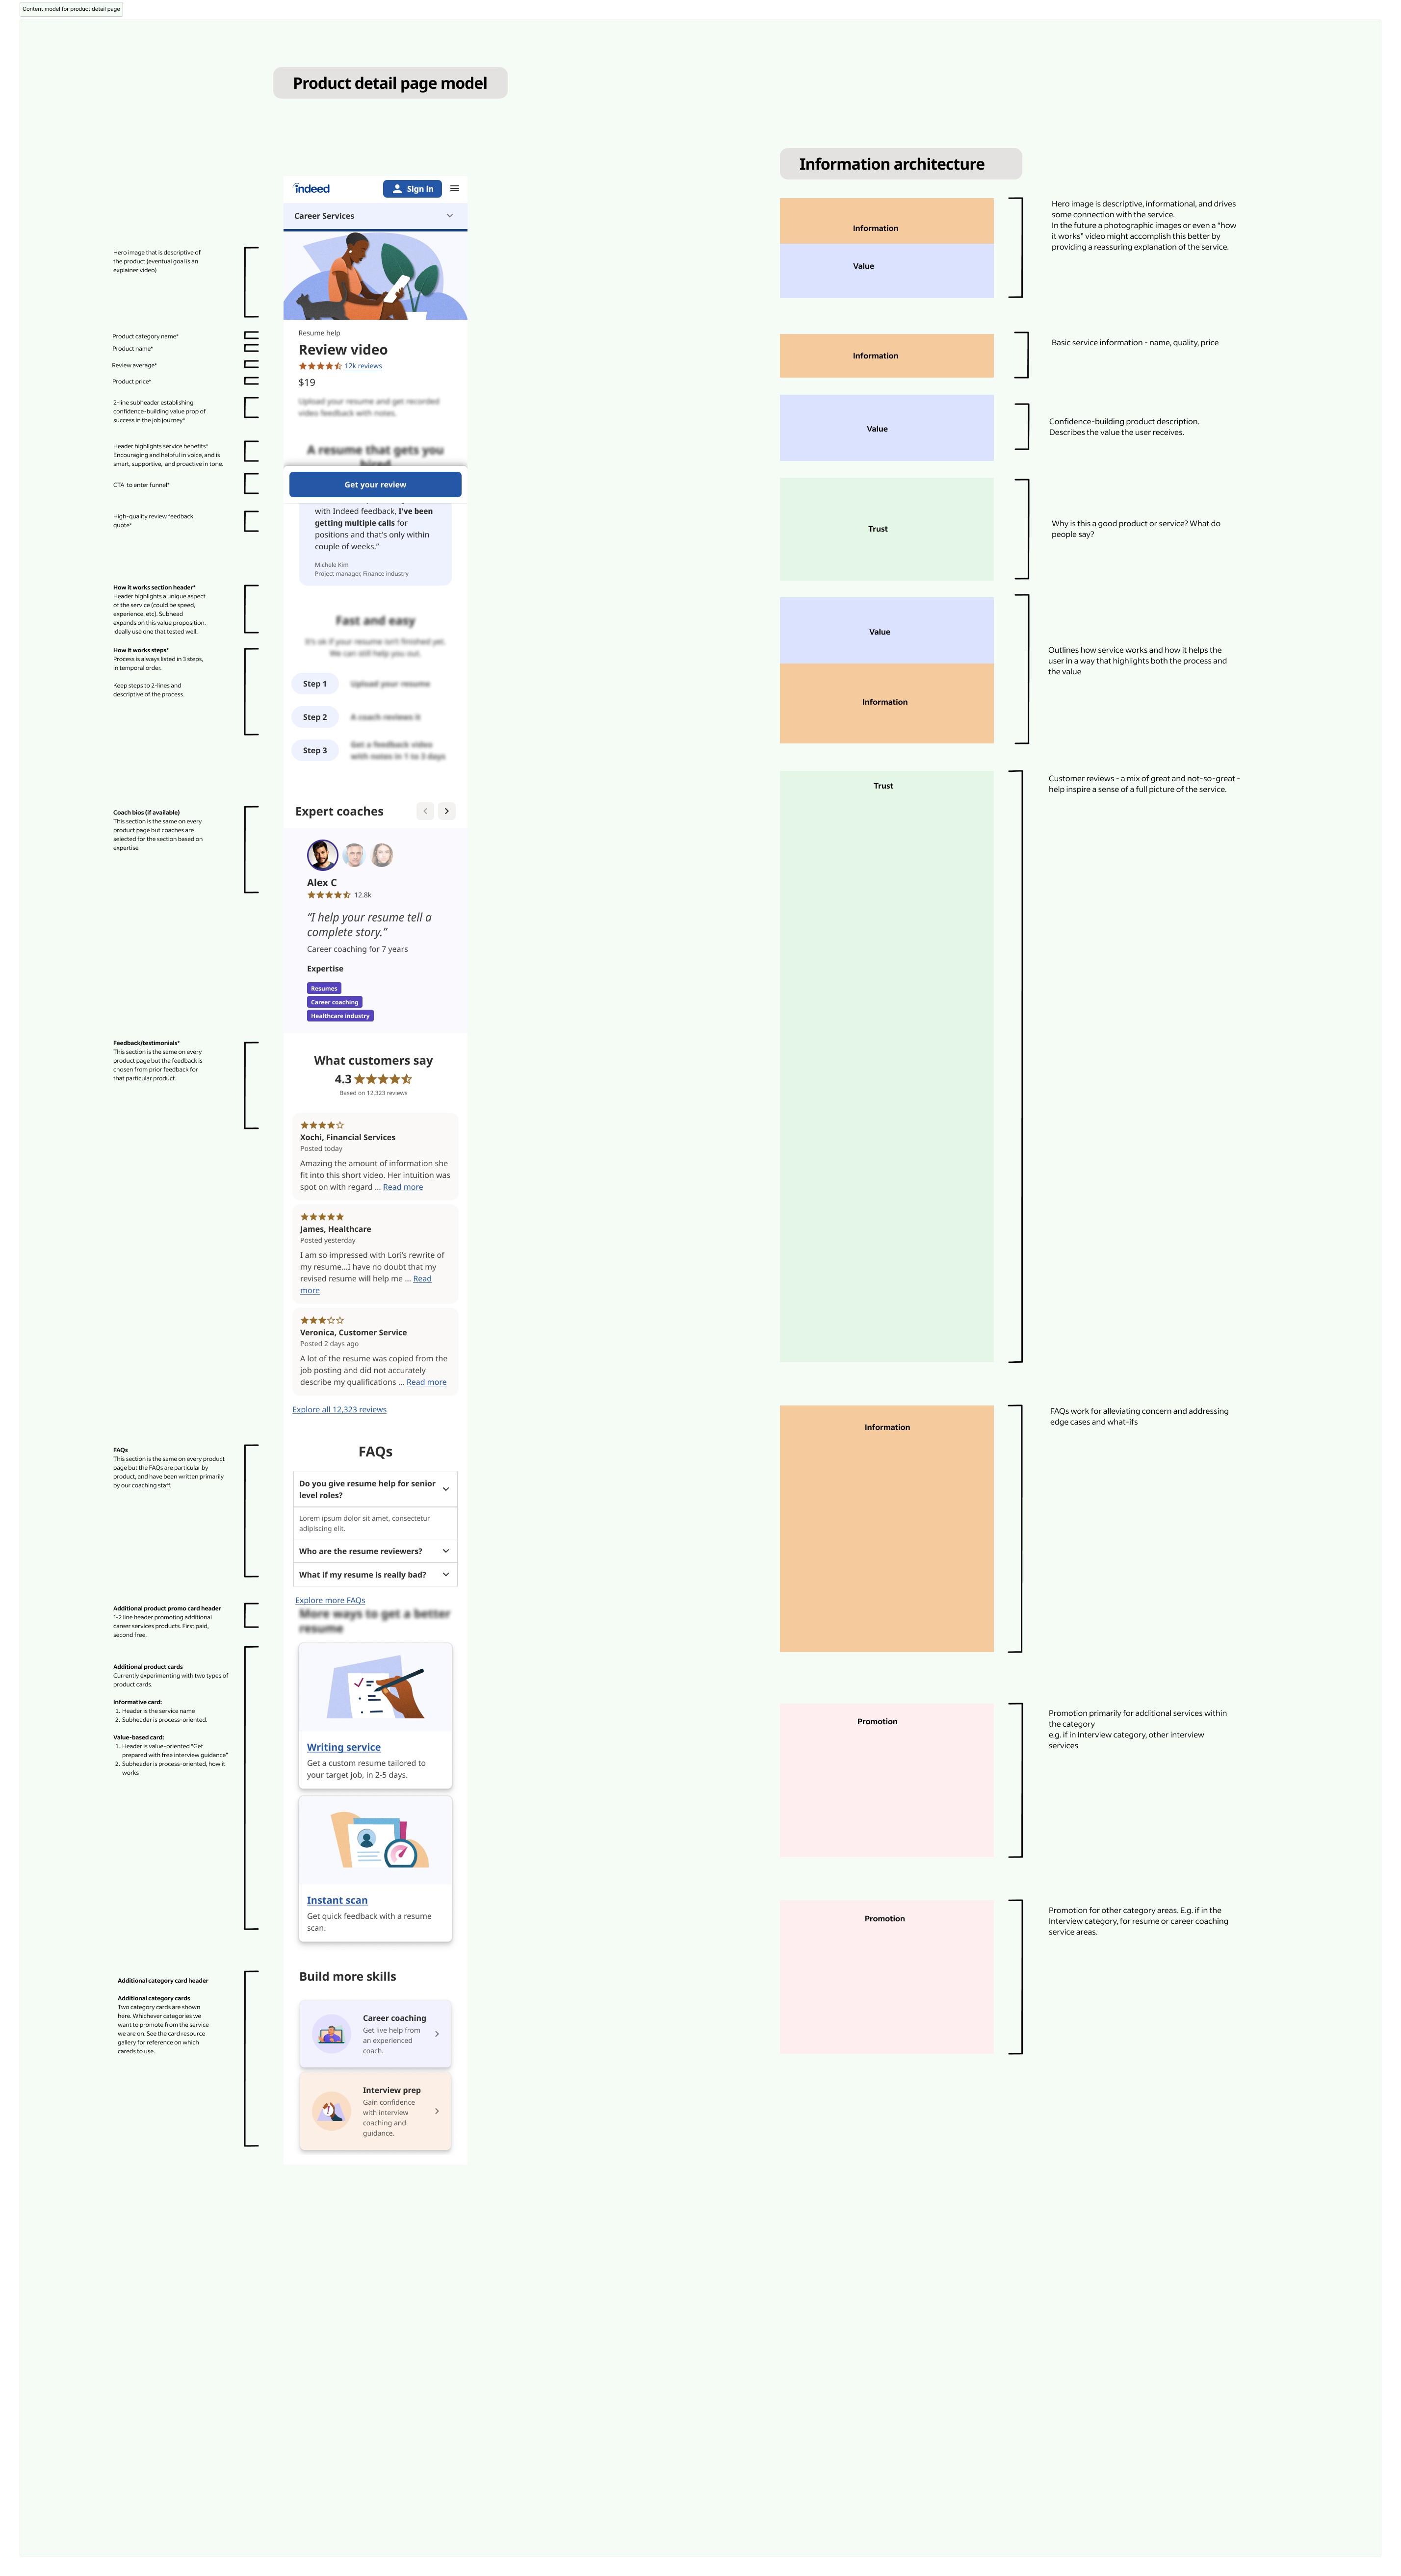
Final content model
After user testing, my design partner and I iterated on the designs, and finalized the information architecture to guide future product detail pages in Career Services.
Results
After shipping these changes, Indeed Career Services was able to rely on a content model whenever new features were added to the suite of products. Additionally, the platform became easier to use and was able to become a revenue-generating product.